E-commerce + GA4: key metrics for marketing, pricing, and store success
July 18, 2023 / 8 min read

Table of contents
How can you use Google Analytics to make the most of your e-commerce business? Read and find out what key e-commerce analytics metrics are available in GA4 and which ones you can use to optimise marketing, pricing and your online store.
Google Analytics is usually associated with measuring website traffic. But the truth is online store owners can use it to benefit from the huge potential of e-commerce data, which significantly facilitates making key business decisions. Of course, to access them, you need to configure tracking and events beforehand properly. However, once we do, you have free access to a whole list of possibilities.
Are you familiar with the advanced analytical capabilities of GA4?
When running an online store, you would probably like to have a tangible confirmation that your business is profitable. You are certainly interested in such elements as:
- The total revenue
- The number of transactions
- The number of new customers
- The amount of traffic on the site
It is likely you also pay attention to ROAS (Return on Ad Spend), AOV (Average Order Value), ARPU (Average Revenue per User) and CAC (Customer Acquisition Cost), CR (Customer Retention) – all these pieces of data are either directly available in Google Analytics or possible to calculate and visualize in Looker Studio. There are many e-commerce analytics tools giving you access to this kind of information and marketing data that online store owners should use to improve their business.
However, these are the most basic, general pieces of e-commerce data, which, yes, illustrate the condition of your online store but are too superficial to plan a detailed strategy including, among others, marketing activities, pricing and discount policy or optimising the website. Thankfully, Google Analytics and data analysis done with this analytics tool allow for much, much more.
Utilising Analytics for marketing and advertising purposes
Marketing activities spend is usually one of the biggest items on the list of costs of any business, not just an e-commerce store. Approach this sensible question wisely. To do this, you need, of course, current data coming from your e-commerce business. However, we advise you to be cautious when it comes to drawing definite conclusions.
Data should always be analysed taking into account various types of contexts and external factors that may affect it (e.g., seasonality or important industry events etc.). You should also pay more attention to long-term trends instead of short, incidental fluctuations. And, of course, you need good e-commerce analytics tools to help you.
Must-watch metrics for marketing activities in GA4
Revenue from specific channels and campaigns
After applying simple filters, you can see in detail not only which channels are responsible for the largest revenue but also dig deeper and learn about the most profitable campaign or even a specific ad.

Revenue from individual products in specific channels
You can go even further in your analysis and find out what sells best on various advertising platforms. Each medium has its own specificity, including the form of communication and different target groups, which means users can have different shopping needs. Having information about the popularity of given products in specific channels, you will be able to prepare more effective advertising campaigns and marketing strategies that drive customer retention, increase customer lifetime value, and avoid unnecessary expenses.
Conversion rates
This metric will show directly (regardless of costs and revenues) which marketing channels are the most effective in bringing users to your business. That is one of the crucial pieces of sales data out there.
Average Revenue Per User (ARPU) or Average Order Value (AOV)
These pieces of customer data will show you the maximum amount of money you can pay for a user or conversion so as not to exceed the break-even point.

Return on advertising expenditure (ROAS) and return on investment (ROI)
If you connect the GA4 account with Google Ads, you will automatically get a full picture of the campaign, including not only advertising revenue but also the number of views of individual creations, clicks, and above all, the costs that they generated. If you want to analyse marketing campaign data from activities in other media in a similar way, you will need an additional tool – e.g., Looker Studio It will aggregate relevant metrics from all sources (more about such solutions can be found in the last part of this article).
User data
This point may relate to demographic or geographic data but also customer segments and information about how visitors behave on our site (customer behaviour data is all about what they are looking for, what type of content they are viewing, etc.). This way, you can understand how your average customer looks and behaves. That’s surely especially useful at the stage of planning target groups for individual campaigns. You can also use this knowledge when planning campaigns and activities in diverse social media channels.
All that information will certainly be useful when it comes to planning campaigns and marketing analytics in general. However, you should be careful not to draw too hasty conclusions from it and take additional factors into account. For instance, the fact that a given advertising channel brings little profit (or no profit at all) does not necessarily mean that you should quit it. E-commerce marketers should know this perfectly.
Conversion paths especially in retail/e-commerce sales can be very long, and other channels – although they do not directly lead to order – also play their role in the process. There is a high probability that you would have fewer sales without these channels in your sales funnel. Perhaps among these "unprofitable" channels are those that are responsible for bringing users to the site for the first time or attracting the most engaged ones. Verify that before you decide to pull the plug.
A better pricing strategy with Google Analytics
Regardless of how much money you make, you want your profit to grow constantly, right? The basic tool for achieving this goal is skilful price control in such a way as to sell as many units of the product as possible at the highest possible profit margin. Of course, reaching the optimal price level (from the seller's point of view) involves many elements, e.g., promotions (driving interest in individual products) and continuous analysis of key sales-related metrics and KPIs (key performance indicators). Data quality is also of significant importance (make sure you process accurate data that provides your company with valuable insights about your website traffic and consumer behaviour).
Most useful metrics in e-commerce pricing in GA4
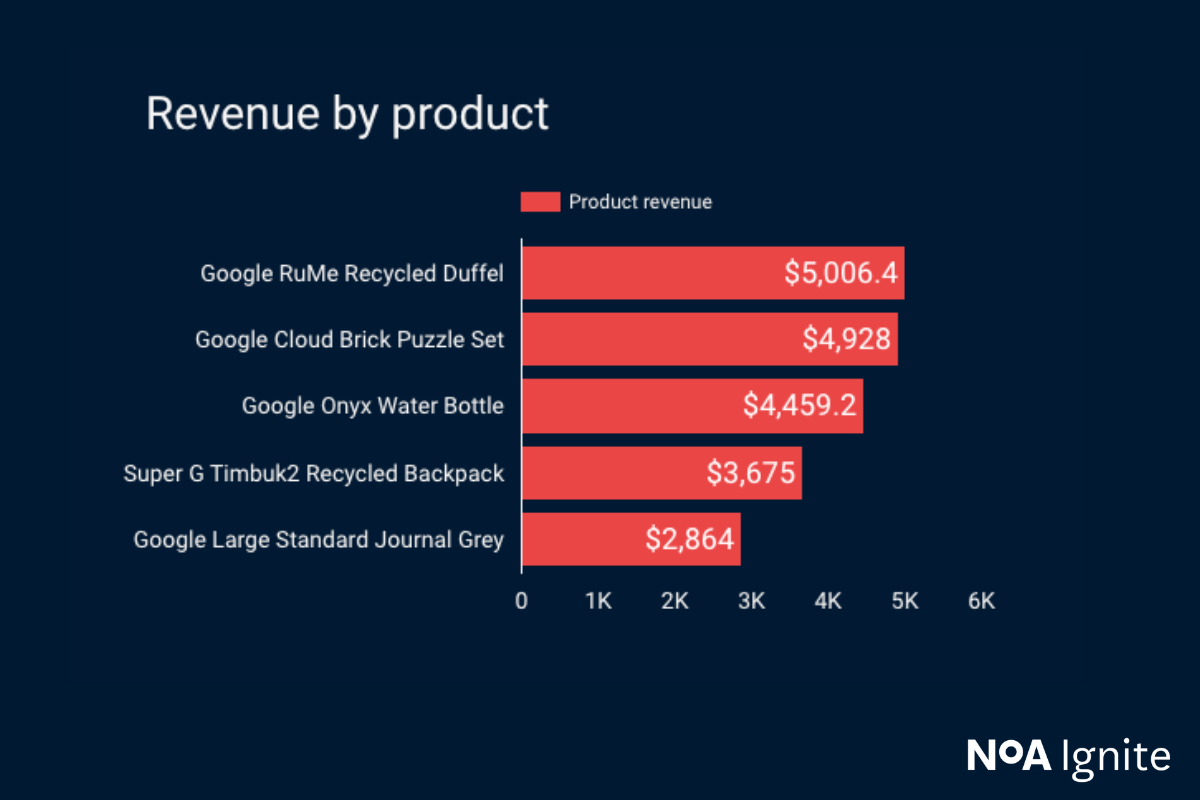
Product revenue and the number of units purchased
These two metrics are typically considered together. Products that sell in large volumes but produce little profit are most often natural candidates for an upward price correction. And vice versa, in the case of the products that do not leave the warehouse, you can probably think of some attractive discount. And what about the products that sell well and generate a large income? Raise the price slightly (hoping that their popularity will stay intact) or think about a small discount to increase the number of orders. Whatever you do, make sure to continually monitor the results of your actions. If you don’t, you can damage customer acquisition and even your entire business performance.

Discounts and promo codes
How do 10%, 30% or 50% discounts affect the number of orders and revenues? You can also easily learn this from Google Analytics reports. You can also analyse the available data from the perspective of promo codes that are assigned to specific products. This allows you to compare the differences in the number of orders and the amount of revenue (depending on whether the product was sold with or without a code). Moreover, you can also verify in which campaigns or ads the code is most frequently used. Use this knowledge to tweak your marketing strategy and reach your target audience more effectively.
Average order value (AOV)
It’s the indicator we’ve already mentioned above. It is worth it for all e-commerce companies to analyse it together with the sum of revenue to ensure that the desired AOV increase does not translate into a decrease in revenue (e.g. because the number of transactions decreased along with the increase in prices).
Returns
According to consumer laws in the European Union and many other countries, consumers have the right to return a product purchased online. More importantly, they use this right increasingly often. When configured correctly, Google Analytics 4 can accurately consider real revenue from online sales, including returns.
Average Revenue Per User (ARPU) and Customer Lifetime Value (CLV)
A decrease in these values over a longer period may lead you to the conclusion that you should take more care to ensure that customers come back to your store. You can do so, for example, through dedicated discounts for specific groups of customers. Of course, the CLV value presented by Google Analytics should always be looked at from a certain distance because it only records contacts and activities related to the store's website, excluding all other channels (e.g., phone and email orders).
Getting access to the right and properly filtered data will enable you to obtain tons of valuable information that will help you plan discounts, as well as your pricing policy accordingly.
Optimise your online store’s website
Online shoppers often view products but do not add them to the cart; they go to the payment subpage but do not buy, etc. Knowledge about user behaviour will help you eliminate the difficulties your customers encounter when shopping at your store and, thus, increase the number of successful orders. It is also worth looking at the popularity of products and, on this basis, deciding which of them should be more exposed on your website.
List of essential metrics for optimising your store in GA4
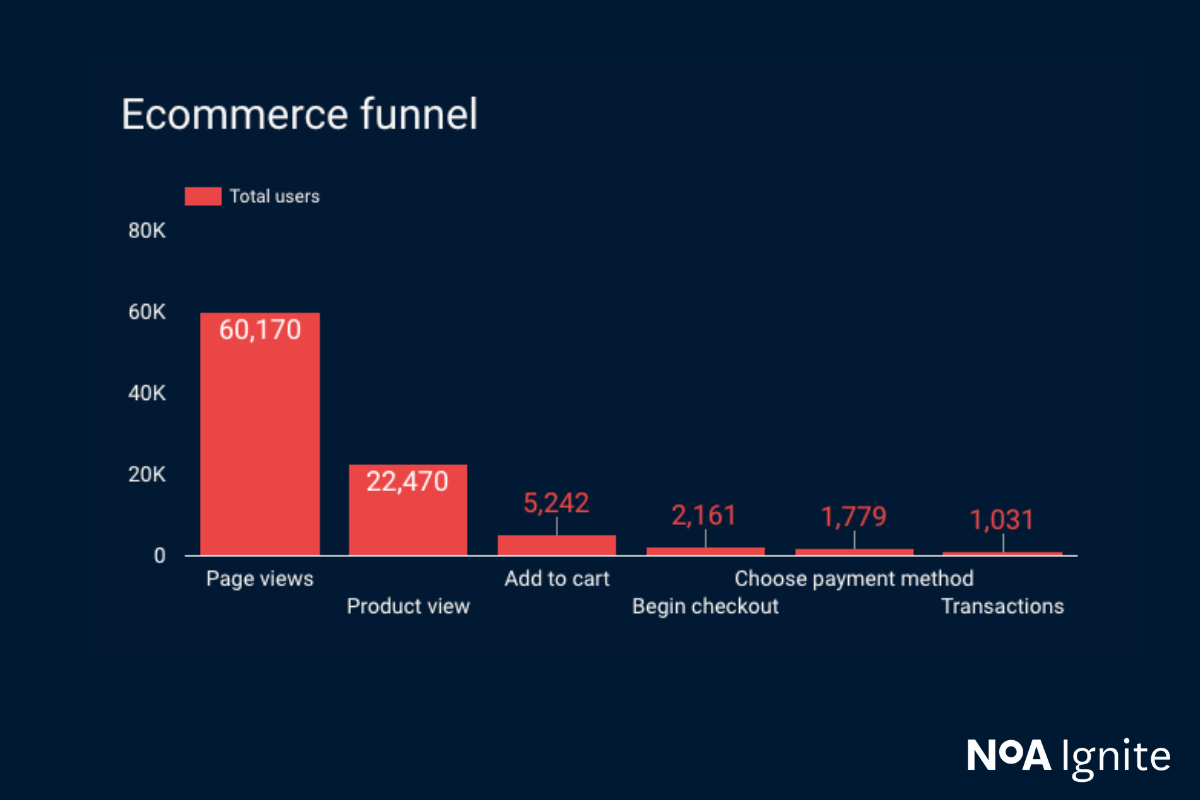
E-commerce sales funnel and customer journey:
This visualisation will show you what percentage of users resign at a specific stage of the purchasing process. This will give you a clear indication of which elements on your website are worth improving. Perhaps the photos or the product descriptions are not encouraging enough? Or maybe you do not offer enough payment options, or the order form is too complicated. Use available data to make an accurate hypothesis.
Search phrases
By analysing the phrases that users enter in your store’s search engine, you will learn their shopping intentions. If a product or a category is searched for unexpectedly often, maybe it's worth making your customers’ life easier by moving it to a more visible place.
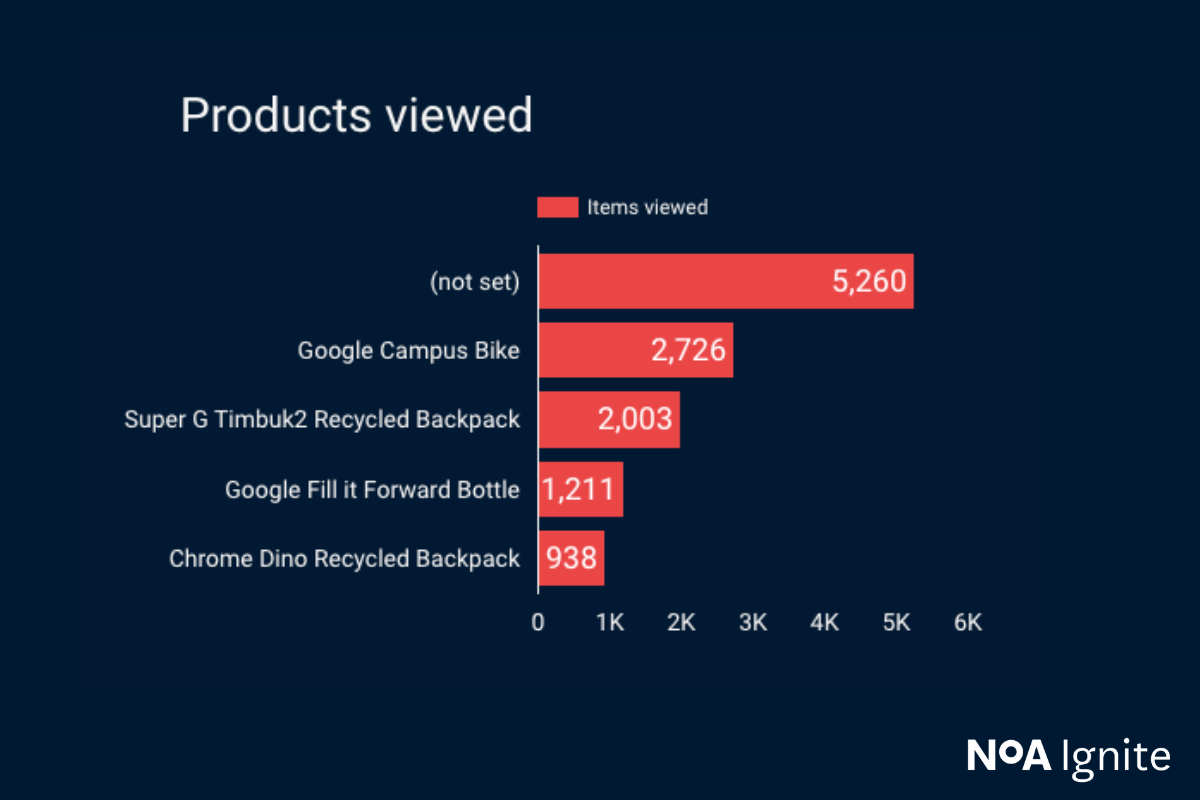
Product interactions
Knowing how often individual items are viewed, added to the cart, and purchased is also essential. Perhaps, based on this input, you will decide to put specific products on the home page. Or you will even want to strengthen the position of the most popular products.
Bounce rate
When analysing specific subpages of your website, it is worth looking at those that have high bounce rates. Think about possible changes that will encourage your customers to stay on the site for longer.
A user-friendly interface and positive shopping experience not only make transactions happen more often but also have a significant impact on customer loyalty (who doesn’t want regular customers?). That’s why it’s so important to analyse your customers’ behaviour and respond to it using every marketing channel in your possession.
Even more tools at your disposal
Google Analytics 4 provides a lot of useful metrics for every online store, but you won't find all the data you need, primarily when it comes to cost-related information. Probably every e-commerce business owner would like to know how much they spend on acquiring customers as well as on activities in other marketing channels. You'd probably like insight into any other additional costs related to your store's operation to calculate the total profitability of your e-business.
In addition to online sales, some companies have a chain of brick-and-mortar stores, and their sales/cost results should also be included in a comprehensive business analysis.
What about your inventory? This is yet another element that should be considered, e.g., when planning a discount.
Other e-commerce software
This is where business intelligence (BI) software comes in handy. It enables you to import various types of data from many diverse sources and systems. Later, you can build interactive dashboards from them. The most popular BI platforms include Tableau, Qlik Sense, Looker and Power BI.
I’m sure you will also benefit from this kind of information. But what if you don’t yet have your GA4 set up for your store? Or maybe you’re looking for unified reports showing data from various sources? I’m happy to help you with all this! I invite you to contact me via email: dorian.pozyczka@noaignite.com.

Book expert consultation
Make sure you set up analytics in your online store correctly. Let us help you benefit from e-commerce data.
Author

Dorian Pożyczka
Digital Analyst
Dorian is an adamant believer in the data-driven approach. For over 10 years, he’s been involved in marketing in the IT sector, where he’s been mainly dealing with the implementation and operation of diverse analytical systems. He knows the Google ecosystem inside-out.
 LinkedIn
Related articles
![A well-crafted prompt doesn’t just work once. It works across teams, channels, and campaigns. It can be tweaked for new use cases and refined based on what performs best.]()
June 27, 2025 / 4 min read
Prompts are marketing assets: how to reuse, and scale them
Prompts aren’t throwaway lines. They’re repeatable, scalable assets that can streamline your marketing your team’s output. Learn how to build a prompt library that delivers.
![Woman using a wheelchair in the office settings]()
June 17, 2025 / 5 min read
What is accessibility and why it matters?
Accessibility ensures everyone — including those with disabilities or limitations — can read, navigate, and engage with your content equally.

