Everything you need to know about IT systems monitoring
January 12, 2021 / 7 min read

Photo by Chris Liverani on Unsplash
Table of contents
Perhaps you think that system monitoring is some sort of dashboard system monitor presented on the TV screen with a number of charts and graphs that large corporations or research centres utilise. Or possibly you believe it’s a solution for a nuclear power plant or another industrial facility. Well, in this article, I’m going to prove you wrong. IT systems monitoring can (and, in fact, should!) be used with a variety of tools, no matter how big your company is. Admittedly, system monitoring brings a lot of benefits both for the development team and for end users! This raises the question – what is the IT systems monitoring all about? You’re about to find out!
In this article, we are going to show you two interesting software solutions – Grafana and Azure Monitor with Application Insights.
Abstract:
- Monitoring setup can be straightforward
- Monitoring is about understanding the system
- Monitoring is not only crucial for the development team but also for departments that are much closer to core business
- Azure Monitor with Application Insights offers huge possibilities for monitoring Cloud Solutions
- Grafana extends possibilities and provides more visualisation options
- Grafana is designed for visualising and analysing custom user metrics, plus those that are available in Azure
Why do you need IT systems monitoring??
IT systems monitoring is vital regarding observing your systems’ state. What is more, apart from the current state, you can predict how it will behave when you increase and activate some additional actions, like, for instance, scaling or adding other resources.
Apart from some kind of dashboard, monitoring also plays an alerting role. After all, you do not want to observe tens of charts continually, but you want to be notified immediately when a specific action is needed. The key is also to build and configure IT systems monitoring so that you immediately see what the problem is. There should be no need to dig into tons of logs to see the root cause of the given issue.
That’s crucial from the business perspective. Suppose you’re running an online store. If your website is not functioning properly, you lose tens or even hundreds of customers every day! With proper IT systems monitoring, you can quickly realise that there is a problem with your website/platform. As a result, you can deal with it quickly and, thus, save both time and money.
Your main goal is to achieve responsiveness and understanding of the situation that happened in order to take adequate steps.
Dashboard system monitor: Benefits for the user
Let us begin with the users’ point of view. Currently, we have a variety of systems. Many of them are critical, like those supporting production processes or trading. Concerning those systems, any downtime can be considered an irreversible loss. For this reason alone, it is so important to act quickly.
Adequate monitoring should not only help developers but also assist less technical people to understand the big picture of what's happening. Thanks to an appropriate response path that can be worked out along with system monitoring, companies can save time and money alike.
Moreover, with effective IT systems monitoring solution, you can use your hardware for a longer time and ensure it works optimally. And if any problems occur, you can fix them with no unnecessary delays, so it’s also quicker (and cheaper) to repair to replace a given part that failed.
IT systems monitoring: Benefits for the development team
There is a saying, "The less you know, the safer you are." However, it's not necessarily the case here. No one wants to be woken up in the middle of the night by a call with a notice that the production system is not down.
Very often, when implementing a new feature of the system or developing some critical core part of it, the development teams wonder what the overall impact of this change will be on the IT infrastructure. Will it affect our databases in the way that the new indexes will need to be created, or will it hit the processing of some asynchronous queue? We can implement a significant number of units and integration tests to spot potential bugs, but you simply can't cover and analyse all possible scenarios. The typical release path consists of deployment to some pre-production environment. This can be a good checkpoint to catch some deviations at the dashboard system monitor.
Increased profitability
That’s the last element we want to mention. You surely understand that malfunctioning IT infrastructure directly affects your income. With IT systems monitoring, you can spot and pinpoint potential problems before they become disastrous to your business. In many cases, you can limit or even remove the risk of downtime altogether! This also translates to increased productivity. Dashboard system monitor solutions are capable of spotting everything that doesn’t work correctly or is even inefficient. With such input, you can improve your IT infrastructure or the production process that it manages.
Let’s go further; system monitoring can be extremely useful when it comes to the cybersecurity of your company. These systems can detect and " catch” unwanted apps and code lines that can seriously damage your IT system. In effect, your business is better protected. Without a doubt, IT systems monitoring is something you just need in your business!
In the next part, we will analyse tools that will help you achieve your goals, and we will focus on the metrics that are worth monitoring.
Grafana and Azure Monitor – a perfect combination
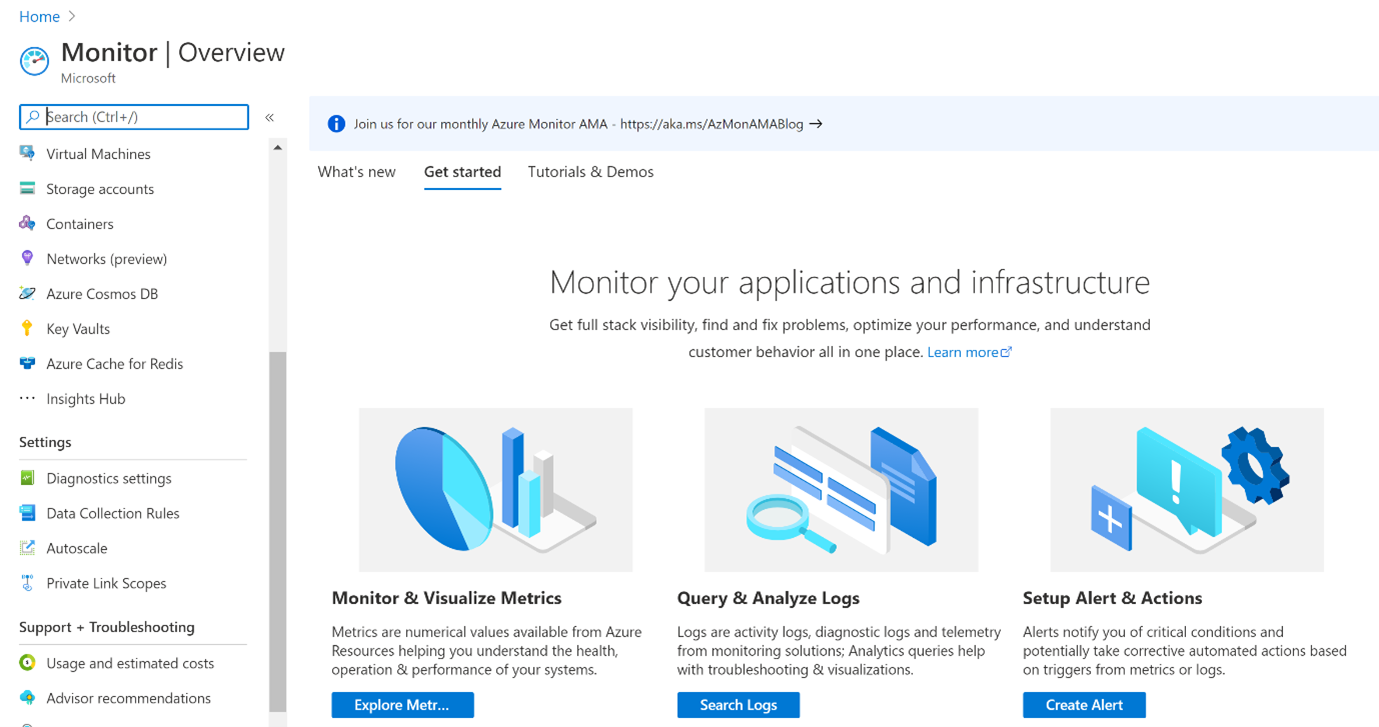
In fact, Azure Monitor is a versatile tool that is tremendous concerning monitoring all relevant resources within your company. According to Azure Portal, Monitor is a tool used primarily for:
- Monitoring & Metric Visualisation
- Querying & Log Analysis
- Alerts setup & taking actions
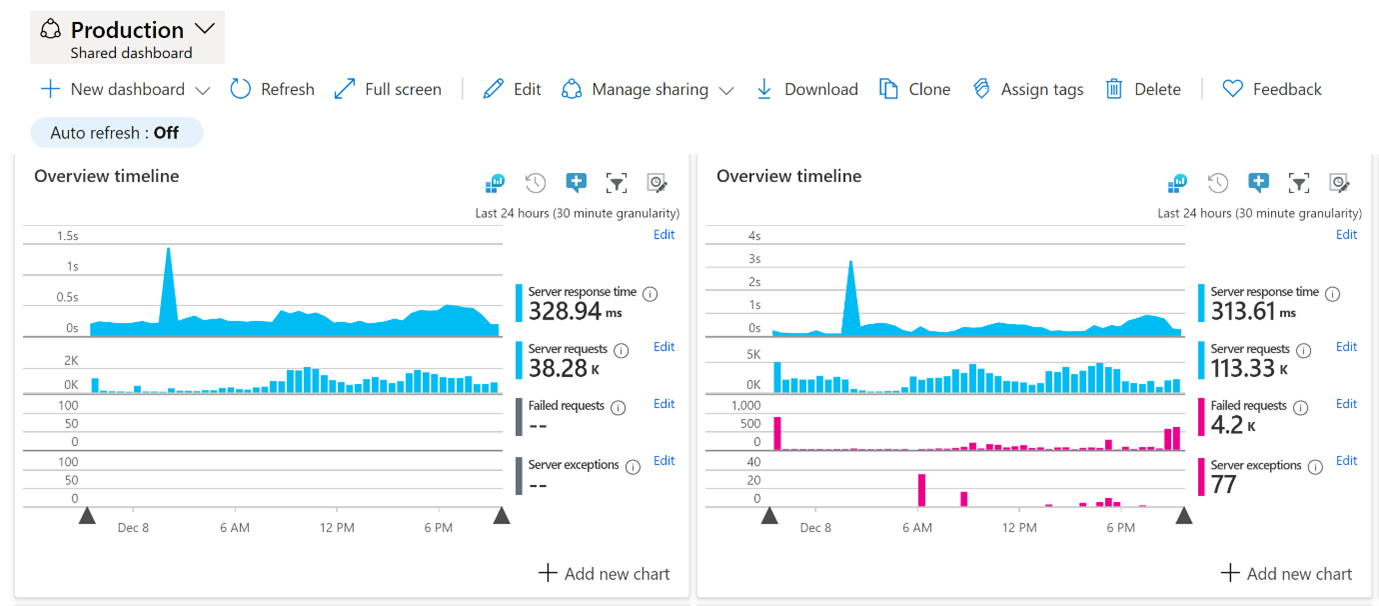
As you can see, Azure Monitor itself provides huge possibilities for monitoring. It exposes numerous metric variables that can be visualised in multiple ways. Together with Application Insights, you can analyse the telemetry from a variety of applications that use .NET, Node.js and Java, hosted on-premises as well as in the cloud. What’s more, you can create your own custom dashboard system monitor that combines all the relevant metrics and results of the most useful Application Insights queries.

Grafana
This tool, on the other hand, provides more visualisation options than the Azure Monitor. It also supports multiple data sources. It can combine data from multiple sources in a single dashboard system monitor, just like Azure Monitor or Elasticsearch, which is extremely useful when you have all resources monitored in a single place.
Grafana is designed for visualising and analysing custom user metrics plus those available in Azure Monitor, like:
- Memory & CPU usage
- Request count
- Exception count and many more
As an output, you can create a smart chart with a few metrics where you can put different units on the axis. Why can it be useful? Because, most likely, you want to observe how a change of one metric affects the other. For instance, does high CPU usage influence the processing of some critical message queues? Can the request timeout be correlated with some timeout on the database level?
Of course, you can say that your system already has an excellent logging level, and you do not need to look at additional fancy charts. And yes, it can be accurate, but the real question is, how much time do you spend on monitoring your systems?
In order to focus on monitoring, I will skip the part where I describe how to integrate Azure with Grafana. This topic is very well-described in many articles. Take a look at this text for instance. In terms of pricing, it always depends on the data volume, retention and usage. For more details, check the Azure Calculator.
Before we make a deep dive into the Grafana charts, let’s consider the easiest thing you can do – creating your own heal check of the critical resources and the APP service itself as simple API that pings resources, for example, every 5 minutes. To run this, we can use the Azure Availability Test from Azure Portal and configure some email alerts that let us know whether or not the test failed. Thanks to that solution, you can be quickly notified which resource is down.
Grafana dashboard system monitor
Let's do the review of some sample metrics that you can get from Azure and showcase on Grafana. Keep in mind that this is just a starting point, you can build your dashboard system monitor gradually, step by step adding new charts depending on your current needs.
Here, we will illustrate the most important metrics like CPU usage, a number or requests per second and IO bytes/s processed.

Then, let’s also have a look at request performance buckets. Very often, you need to fit into the requirements that the system imposes in order to process some percentage of request below n ms/s. Having such values at the chart, you can quickly verify them.
This interesting statistic focuses on a ratio: The total number of requests vs. failed ones. The sudden deviation of failed requests may be an alert that some specific action needs to be taken in the system, and your users are currently experiencing some serious problems.

Going further, let’s also drill down into the specific number of the HTTP client and server errors. Even though 4xx errors are typically client-related, it is often useful to know which error code a user is encountering to determine if the potential issue can be fixed.

Now, when it comes to the most critical chart: Server exceptions vs. HTTP server errors. When the server exception pops up, you should definitely check application logs to see the root cause.

As we have a basic set of measurements to observe, it's essential to think about what is specified in your system? Is there a particular API request that is critical and needs to be continuously monitored?
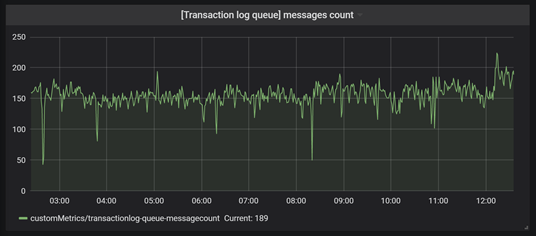
Above all, you ought to observe queues where some asynchronous processing is taking place. Does your system have any limits of concurrently processed messages? If you observe peaks at the chart, take a moment for further analysis. Check which resources are in use, ensure that a bottleneck hasn��’t occurred. If needed, observe them as well. Activate an alert when the processing of the message fails.

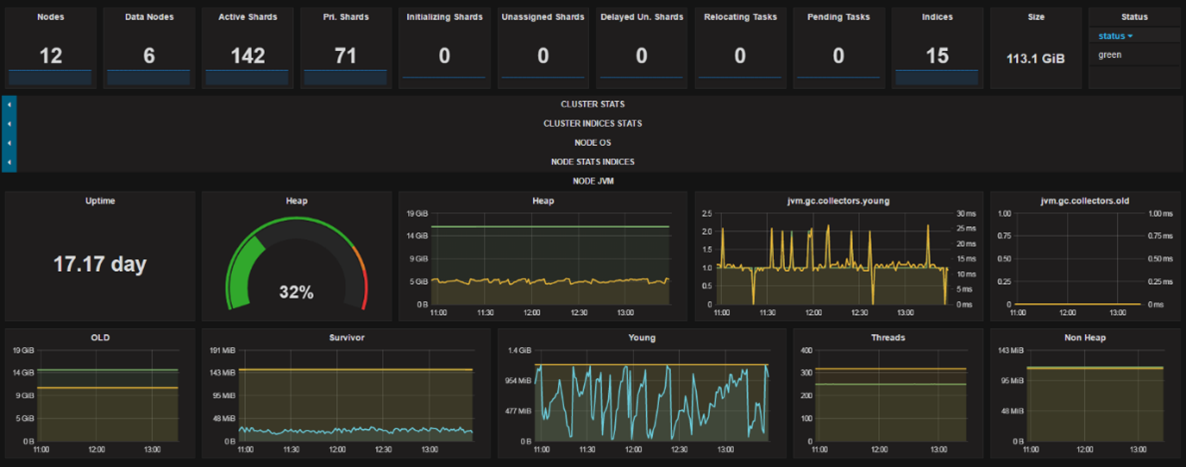
The Grafana charts shown above can be only a starting point in the system observation. If you are looking for something specific, like, for instance, full monitoring of your Elasticsearch clusters but you do not know how to start, go here and check whether there’s a dashboard system monitor built by the Grafana community that you can easily download as a JSON file, import it, configure data source and voila – you’re ready to go!
IT systems monitoring: Summary
It's fair to conclude that each organisation, regardless of size, can benefit from sound system monitoring software.
With some big names available on the market, system monitoring solutions should always be considered as an essential aid in your everyday work. As organisations develop and grow, IT systems monitoring can act both as a safety cushion and a springboard to the future with its many functions and features.
Premature optimisation may not be the best practice, but IT systems monitoring can just be the perfect solution for your company!
Author

Ewelina Zarębska
Senior .NET Developer
Ewelina is a specialist in all types of Cloud topics, from designing architecture to the proper development of cloud applications. She connects business needs with technology, prioritization and cost optimisation. For over 10 years, she’s been advising on platform choices and combining off-the-shelf and custom solutions with costs in mind.
Related articles
![A well-crafted prompt doesn’t just work once. It works across teams, channels, and campaigns. It can be tweaked for new use cases and refined based on what performs best.]()
June 27, 2025 / 4 min read
Prompts are marketing assets: how to reuse, and scale them
Prompts aren’t throwaway lines. They’re repeatable, scalable assets that can streamline your marketing your team’s output. Learn how to build a prompt library that delivers.
![Woman using a wheelchair in the office settings]()
June 17, 2025 / 5 min read
What is accessibility and why it matters?
Accessibility ensures everyone — including those with disabilities or limitations — can read, navigate, and engage with your content equally.


